Optimizing Real World Go Bobby Powers
05 January 2013
This is about some fun I had while putting together a small Unix-y utility to measure RAM and swap usage - psm. I was able to decrease runtime by more than 65% during a 3-hour train ride with the help of some standard go tools.
Background
At my place of employment we’ve had memory-usage problems over the past month, following a restructuring in how we distribute long-running jobs between ec2 instances. In the course of several minutes to several hours, on each machine the memory usage of 8 celery jobs would grow first to fill all available RAM, and eventually all RAM + swap - invoking the wrath of the Linux OOM killer. This was an unfortunate series of events, particularly so because it only happened with any frequency on production.
While investigating I made frequent use of the excellent ps_mem.py
by pixelbeat
(source).
This script is fantastic, especially since I can run it remotely with:
$ cat `which ps_mem` | ssh $REMOTE_HOST -- sudo python
The two (minor) downsides are that it requires a custom sudo rule for non-admin users to be able to use it:
%developers ALL= NOPASSWD:/usr/bin/ps_mem.py
And it is somewhat slow, especially if the server is under load (due to memory pressure/swapping) or the number of total mappings is large.
After our immediate issues were resolved (a separate story), I spent some time over the holidays seeing if I could implement something similar in Go which would run quickly and be installable as setuid root, so that devs who don’t have root on our production boxes could quickly see who was using what RAM and swap. In addition, it would be a fun way to dig in to the proc filesystem, learn a bit more about how the kernel accounts for memory, and write some Go. Wins all around.
I thought hard about trying to speed up ps_mem.py itself, but since this was a spare time fun hack, I gave into my latent Not Invented Here syndrome so that I could write something fresh up in Go.
World, meet psm
“It’s like ps_mem.py, but easier to type”
The end result is a small program, psm, which produces output
similar to ps_mem.py, but with the addition of a column for swap
usage:
bpowers@python-worker-01:~$ psm -filter=celery
    MB RAM    SHARED   SWAPPED	PROCESS (COUNT)
      60.6       1.1     134.2	[celeryd@notifications:MainProcess] (1)
      62.6       1.1          	[celeryd@health:MainProcess] (1)
     113.7       1.2          	[celeryd@uploads:MainProcess] (1)
     155.1       1.1          	[celeryd@triggers:MainProcess] (1)
     176.7       1.2          	[celeryd@updates:MainProcess] (1)
     502.9       1.2          	[celeryd@lookbacks:MainProcess] (1)
     623.8       1.2      28.5	[celeryd@stats:MainProcess] (1)
     671.3       1.2          	[celeryd@default:MainProcess] (1)
#   2366.7               164.7	TOTAL USED BY PROCESSES
It took me a leisurely day at a coffee shop
of studying ps_mem.py, the kernel’s fs/proc/task_mmu.c, and
hacking to get some useful output. The optimization was all done on
an Amtrak ride from NY to DC, and the rest of my time on the project
has been spent on small cleanups, documentation and packaging. The
GitHub page for psm has
installation instructions, but for brevity if you’re on Ubuntu 12.04
and interested in trying it out you can simply do:
# if apt-add-repository isn't installed:
$ sudo apt-get install python-software-properties

$ sudo add-apt-repository ppa:bobbypowers/psm
$ sudo apt-get update
$ sudo apt-get install psm
How does it work?
Each running process on a Linux machine is associated with a set of
virtual-memory areas known as VMAs, and each VMA has an entry in
/proc/$PID/smaps like so:
7fff6b915000-7fff6b937000 rw-p 00000000 00:00 0                  [stack]
Size:                140 kB
Rss:                  12 kB
Pss:                  12 kB
Shared_Clean:          0 kB
Shared_Dirty:          0 kB
Private_Clean:         0 kB
Private_Dirty:        12 kB
Referenced:           12 kB
Anonymous:            12 kB
AnonHugePages:         0 kB
Swap:                  0 kB
KernelPageSize:        4 kB
MMUPageSize:           4 kB
Locked:                0 kB
VmFlags: rd wr mr mw me gd ac
There are VMAs for each process’s stack and heap, and every
dynamically-linked library in a program results in several VMAs (code,
static data, and variables are mapped separately, with different RWX
permissions). mmap(2) calls also result in the creation of a VMA.
psm and ps_mem.py iterate through each process’s
/proc/$PID/smaps file, summing the Pss, Swap and Private_* fields to
arrive at the total memory used.
Make it fast!
I really like optimizing code. Its taken years to develop the restraint to wait until I have something working before I try to make it faster.
Goal
My objective was simple - make psm output its results and exit as
quickly as possible.
Tools of the trade
To make psm faster, I had to know what its current speed was. I
cycled between three tools: the bash time builtin, the GNU
time(1) command, and go’s
pprof tool. There is surprisingly
little documentation about bash’s time builtin, but I assure you it
exists (time_command() in bash 4.2’s
execute_cmd.c) - I used it because it provides an extra decimal of
precision over time(1). I should also mention I did my testing on my
laptop’s Fedora 18 install, with the
latest version of Go’s default branch installed. In general there
have been some nice improvements since go1 was released, but I didn’t
explicitly test go1 vs Go default.
The seminal article on Go profiling is
Profiling Go Programs
on the official blog - I had that open in a tab as a reference the
whole time I was cycling through this. Profiling Go Programs is from
the pre-go1 period, the two mental adjustments to make while reading
it are s/make/go build/ and s/gopprof/go tool pprof/. I added the
necessary profiling options as command line flags to psm in a
single commit,
after I had gotten the code working and output format stable. I didn’t
want to get distracted working on this too early, and also didn’t want
to decide halfway through profiling to change the data displayed
(making the second half of profiling results incomparable with the
first).
Preexisting knowledge
I’ve done one major round of go profiling before, for an internal platform at SocialCode, and a few things have stuck in my head from that:
- Not Go specific, but if you want to make things go faster, especially in a garbage collected language, think about memory usage. “If you’re allocating millions of objects per second, you’re gonna have a bad time.”
- Corollary: allocations (eventually) result in garbage.
- Conversion between
[]byteandstringincurs a memory allocation and a memcpy. Go strings are immutable - so when you convert a byte slice to a string (string([]byte{'a', 'b'})) or vice versa, the runtime makes a private copy of the data. - The Go authors are smart. C, Unix, Plan 9, xv6 - they have a decent track record. Try hard to use their code, until you can benchmark that you truly have a special case that can take some shortcut. In that case - copy, paste and modify their code :).
Methods
Basically: go build, time sudo time ./psm $PROF_OPTS, rinse,
repeat. $PROF_OPTS is either -cpuprofile=cpu.prof or
-memprofile=mem.prof. Its not very useful to run both of them at
once, unless you’re looking to benchmark the runtime/pprof package
itself. The seemingly dual time invocation is awkward, but results in
the most immediately useful info. psm
v0.1 results in:
#   2569.9                 0.0	TOTAL USED BY PROCESSES
1.25user 0.34system 0:00.51elapsed 310%CPU (0avgtext+0avgdata 2792maxresident)k
0inputs+0outputs (0major+773minor)pagefaults 0swaps

real	0m0.524s
user	0m1.256s
sys	0m0.351s
On my machine, userspace applications were using 2570 MB of RAM with
nothing swapped out (this first line is from psm itself), while
psm took .52 seconds to run, using a maximum of 2.7 MB of memory
itself. What is interesting is that user + sys is significantly less
than real - this is due line 328 in main.go:
// give us as much parallelism as possible
nCPU := runtime.NumCPU()
runtime.GOMAXPROCS(nCPU)
for i := 0; i < nCPU; i++ {
	go worker(work, &wg, result)
}
Both the kernel and userspace are doing a lot in parallel. I’ve got
an dual-core CPU with hyperthreading - runtime.NumCPU() returns 4.
As an experiment, if we hardcode nCPU := 1 we can verify that psm
runs slower:
0.66user 0.18system 0:00.84elapsed 100%CPU (0avgtext+0avgdata 2136maxresident)k
0inputs+0outputs (0major+589minor)pagefaults 0swaps

real	0m0.851s
user	0m0.668s
sys	0m0.184s
Runtime is increased to .851 seconds even though user + sys are individually lower - parallelism introduces locking, synchronization, and memory overhead (note the decrease in pagefaults), but in this case it’s worth it.
Now we have a performance baseline, and can start improving. We use the go runtime’s built in CPU and memory profiling support, coupled with the pprof tool to dig into the details of where we’re spending our time:
$ go build && sudo ./psm -cpuprofile=cpuprof.1
...
$ go tool pprof ./psm cpuprof.1
(pprof) web
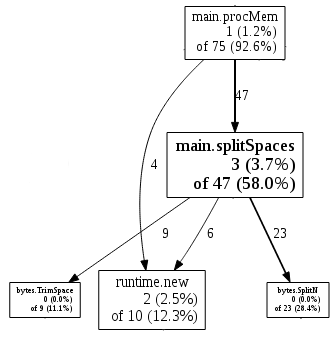
Total: 81 samples
Loading web page file:////tmp/pprof31371.0.svg
There are several ways to explore pprof data. One of the easiest is
the graphviz-dependent web command, which pops up an SVG in your
browser:

Cool, so 93% of our time is spent in procMem where we total each
process’s memory usage, and most of that is in turn spent in the
splitSpaces utility function. Looks like a good place to start.
When we start optimizing, percent of total-time isn’t comparable
between profiles, but number of samples is.
Digging in
Each line in /proc/$PID/smaps has several columns with an arbitrary
number of spaces between them. As donio from
HN pointed out,
bytes.Fields does what I am looking for. At the time I wrote psm,
I someohow completely overlooked that and threw my own splitSpaces
together. The initial implementation was pretty naive:
func splitSpaces(b []byte) [][]byte {
	res := make([][]byte, 0, 6)
	s := bytes.SplitN(b, []byte{' '}, 2)
	for len(s) > 1 {
		res = append(res, s[0])
		s = bytes.SplitN(bytes.TrimSpace(s[1]), []byte{' '}, 2)
	}
	res = append(res, s[0])
	return res
}
splitSpaces is called for each line in /proc/$PID/smaps. How many
lines is that? Currently on my laptop:
[root@fina /]# cat /proc/**/smaps | wc
 406608 1370315 13109167
Okay, so 400k lines of text, totaling 12 MB. Of all the (83) times
the Go pprof thread woke up to record data about psm, 47 of them
were in splitSpaces or a function called from it. bytes.SplitN
and bytes.TrimSpace let me quickly implement the thing, but my usage
of them is too inefficient. My take-two
(v0.2) was:
func splitSpaces(b []byte) [][]byte {
       res := make([][]byte, 0, 6) // 6 is empirically derived
       start, i := 0, 0
       lenB := len(b)
       for i = 0; i < lenB; i++ {
               // fast forward past any spaces
               for i < lenB-1 && b[i] == ' ' {
                       i++
                       start = i
               }
               for i < lenB-1 && b[i] != ' ' {
                       i++
               }
               if i > start {
                       // we sometimes have to rewind
                       if i < lenB-1 && b[i] == ' ' {
                               i--
                       }
                       res = append(res, b[start:i+1])
                       start = i + 1
               }
        }
        return res
}
This is pretty mind-numbingly complicated with its multiple doubly-nested loops and conditional rewind (I had to add tests to make sure it was working correctly), but is it faster?

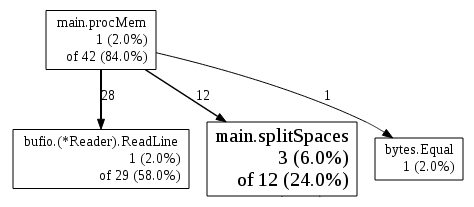
All right! So, yes, splitSpaces is down from 47 to 13, a 3.6×
improvement. A big part of this improvement came when I
switched
from calling unicode.IsSpace() to checking b[i] == 0 directly. I
made a mental note to come up with something more sane for
splitSpaces, but for now lets move onto other low hanging fruit.
Now, 38 of procMem’s samples are in bufio.Reader.ReadLine(), and
30 of those 38 samples are in syscall.Syscall() itself. That means
that 79% of the runtime of ReadLine() is simply spent waiting for
smaps data from the kernel. Not much I can change in my userspace
program to get around that, so lets move on. The next biggest user of
CPU time was the 9 samples spent in runtime.slicebytetostring() -
the routine called for code like string([]byte{'a', 'b', 'c'}).
There are 2 places in procMem() where we convert byte slices to
strings. The fist is where we figure out what type of smap line we’re on:
func procMem(pid int) (pss float64, shared, priv, swap uint64, err error) {
	for {
		...
		ty := string(pieces[0])
		switch ty {
		case "Pss:":
			...
		...
		}
		...
	}
}
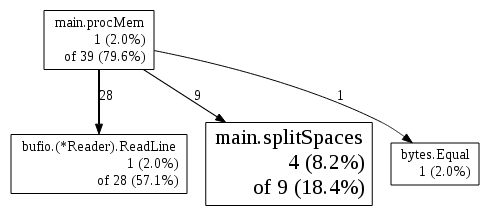
I like how clean switch statements look, but its a little unnecessary to do ~400k malloc + memcpy’s (one for every line in smaps) just to compare some bytes. This should remove that overhead:
var tyPss = []byte("Pss:")
func procMem(pid int) (pss float64, shared, priv, swap uint64, err error) {
	for {
		...
		ty := pieces[0]
		if bytes.Equal(ty, tyPss) {
			...
		...
		}
		...
	}
}
The other place in procMem where slicebytetostring is called is
when we convert a []byte field to an integer. The routines in
strconv only accept string arguments, so we must convert:
case "Swap:":
	v, err = strconv.ParseInt(string(pieces[1]), 10, 64)
	if err != nil {
		err = fmt.Errorf("Atoi(%s): %s", string(pieces[1]), err)
		return
	}
	swap += v
}
Unfortunately, the only way I could see to get around this was to fork
(copy/paste) the ParseInt function from strconv, and change its
declaration to accept a []byte argument. I copied the file in with
33d7fe8a,
and modified it in
77e0408f.
I was on a roll at that point, so that second commit also removes a
O(n) string search and replaces it with an O(1) length check for
whether an smaps line should be skipped.
The results?

0.24user 0.28system 0:00.17elapsed 292%CPU (0avgtext+0avgdata 5048maxresident)k
0inputs+8outputs (0major+941minor)pagefaults 0swaps

real	0m0.186s
user	0m0.246s
sys	0m0.285s
Much better! We’ve gotten more than twice as fast. The last thing
left to do is see if I can make splitSpaces sane while keeping it
fast. I played around with that for a while, even creating a
micro-benchmark,
but the benchmark ended up not being very useful. Techniques that
improved overall runtime weren’t necessarily reflected in the
benchmark results. The current version of splitSpaces is:
func splitSpaces(b []byte) [][]byte {
	// most lines in smaps have the form "Swap: 4 kB", so
	// preallocate the slice's array appropriately.
	res := make([][]byte, 0, 3)
	start := 0
	for i := 0; i < len(b)-1; i++ {
		if b[i] == ' ' {
			start = i + 1
		} else if b[i+1] == ' ' {
			res = append(res, b[start:i+1])
			start = i + 1
		}
	}
	if start != len(b) && b[start] != ' ' {
		res = append(res, b[start:])
	}
	return res
}
And improves performance ~ 9% over the previous implementation. Finally, I removed the tracking of shared-memory (since it can be derived as Pss - private), which shaved a few more percentage points off. The final profile looks like:

0.26user 0.25system 0:00.16elapsed 319%CPU (0avgtext+0avgdata 5164maxresident)k
0inputs+8outputs (0major+906minor)pagefaults 0swaps

real	0m0.170s
user	0m0.266s
sys	0m0.258s
Memory usage
I had trouble getting useful memory allocation info out of pprof apart
from the side-effects visible on CPU profiles, like the
byteslicetostring() discussion above. time(1) consistently
measured psm’s max memory usage as at or under 5 MB, so it doesn’t
seem to be much of an issue.
Wrapping up
I love programming in go. It provides an environment where I can quickly produce production-quality code with awesome auto-generated docs. On top of that it provides easy, built-in tools for profiling, making optimization (even more) fun.
UPDATE: I edited the part where I tried to claim that the Go standard
library didn’t have anything that worked like splitSpaces.
bytes.Fields does indeed already exist, as pointed
out on Hacker News. I
would still have come to the same conclusion - bytes.Fields is much
slower than my final splitSpaces function due to its use of
unicode.IsSpace (.249 seconds runtime vs .158, currently).
blog comments powered by Disqus